Hace algúnos días "elabuelo"
inició en nuestro foro un hilo (http://centrader.net/phpBB/viewtopic.php?t=57)
que consideramos muy interesante, en torno a los gráficos de punto
y figura y su utilización en el análisis y elaboración
de estrategias de trading. Hoy nos envía este artículo que seguro
resultará "sabroso" para todos aquellos que deseen ampliar
conocimientos sobre tan interesante instrumento.
Un saludo.
Point and Figure Patterns
Overview
Point and Figure charting
differs from other charting techniques by the fact that it only requires price
for analysis, not time. It is also plotted differently by using columns and
rows using price movement only.
Point and Figure was
developed towards the end of the nineteenth century. This new form of charting
was referred to as the "book method". The book method was applied by
entering the actually prices into the rows and columns however this proved to
be not very popular since it was time consuming to enter the entire price. It
was upgraded by the early twentieth century into point and figure. Unlike the
book method, point and figure uses the symbol X or O to describe the price
movement rather than writing the entire price into the field.
There is also a
significance given to the number three in point and figure charting. When
movements hit the support or resistance line, extra attention should be spent
on the third collision. There is also quite a few patterns where the third hit
is when the signal is generated.
Due to the accuracy of the
signals provided by point and figure charting, interest in this form of
analysis is continuously growing.
Point and Figure patterns
can be categorized by "bearish", "bullish", "reversal", and "wait and see" (trend continuation).
Bullish Point and Figure Patterns
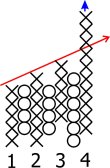
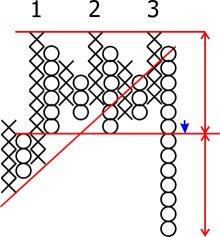
Triple Top
|
|
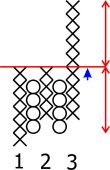
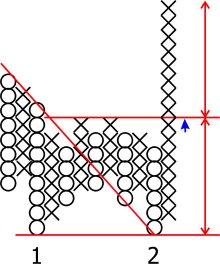
The pattern is formed by
three rallies (1,2,3), on the third rally it pushes past the resistance line
formed by the first two. The third column will
rise past the resistance line an equal distance to that of the bottoms. |
Breakout of a Spread
Triple Top
|
|
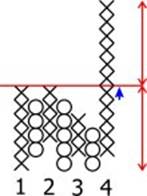
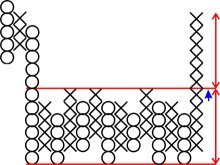
This pattern is a variation to the triple top except that on the third rally it fails to reach the resistance line. On the fourth move it breaks past the resistance line and should rise an equal amount to that of it's bottoms. |
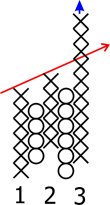
Ascending Triple Top
|
|
Another variation of the triple top except in this case each consecutive top is higher than the last. However this pattern does not give a price objective like the triple top. The signal in this variation is to buy on the breakout. |
Upward Breakout of a
Bullish Resistance Line.
|
|
A variation of the ascending triple top except in this case there is a fourth consecutive top is higher than the last. The signal in this variation is to buy on the breakout. |
Upward Breakout of a Bearish
Resistance Line.
|
|
This pattern consists of a consecutive series of lower highs. When the price breaks through the resistance line a buy signal is given. |
Bullish Trend Reversal
Patterns
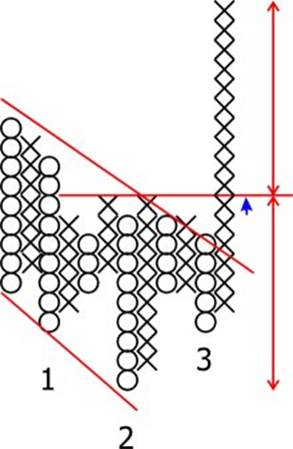
Inverted Head and
Shoulders Pattern
|
|
The inverted head and
shoulders pattern is found in candlestick, point and figure, and chart
patterns and is considered one of the most reliable reversal patterns. The price forms a low on
column one, followed by a period of consolidation. A second low is created
followed by another period of consolidation, the right shoulder is then
formed followed by a buy signal as it crosses the neckline. Parralel support and resistance lines can
be drawn as well as a visible neckline. The height of the lowest
low should give a projection of the strength of the upward move. |
Triple Bottom
|
|
The triple bottom is a variation of the inverted head and shoulders pattern. This pattern consists of three lows of similar height. After the third low is formed and the price movement breaks the neckline, a bullish signal is given. The expected rise should be of similar height as from the neckline to the low. |
Double Bottom
|
|
The double bottom is a variation of the triple bottom pattern. This pattern consists of two lows of similar height. After the second low is formed and the price movement breaks the neckline, a bullish signal is given. The expected rise should be of similar height as from the neckline to the tops. It is important to note that before the breakout, the trend line is broken. |
Bullish Rectangle Reversal
|
|
The downtrend forms a clear period of consolidation, the resistance line is then broken on a heavy volume day, it is at this point where the bullish signal occurs. |
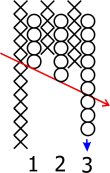
Bearish Point and Figure Patterns
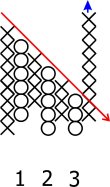
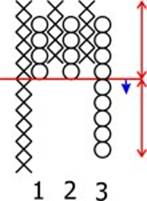
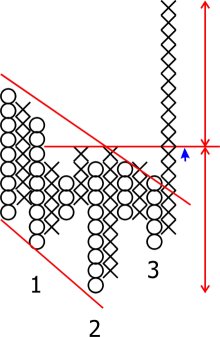
Triple Bottom
|
|
The pattern is formed by
three downs (1,2,3), on the third drop it pushes past the support line formed
by the first two. The third column will
drop past the support line an equal distance to that of the tops. |
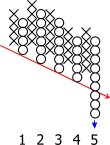
Breakout of a Spread
Triple Bottom
|
|
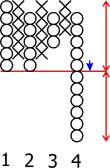
This pattern is a variation to the triple bottom except that on the third rally it fails to breach the support line. On the fourth move it breaks past the support line and should drop an equal amount to that of it's tops. |
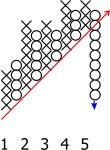
Descending Triple Bottom
|
|
Another variation of the triple bottom except in this case each consecutive low is lower than the last. When the price drops below the support line this generates a clear selling signal. |
Downward Breakout of a
Bearish Support Line.
|
|
A variation of the descending triple bottom except in this case there is an upward bias. The signal is to sell on the support line breakout. |
Downward Breakout of a
Bullish Support Line.
|
|
This pattern consists of a consecutive series of higher lows. When the price breaks through the support line a sell signal is given. |
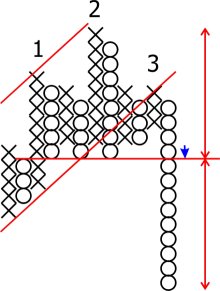
Bearish Trend Reversals
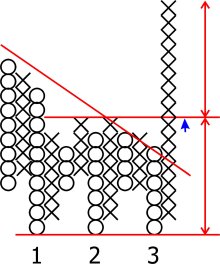
Head and Shoulders
|
|
The head and shoulders
pattern is found in candlestick, point and figure, and chart patterns and is
considered one of the most reliable reversal patterns. The price forms a high on
column one, followed by a period of consolidation. A second high is created
followed by another period of consolidation, the right shoulder is then
formed followed by a sell off. High volume should be seen on the last
downward move. Parralel support and resistance lines can
be drawn as well as a visible neckline. The height of the highest
high should give a projection of the drop of the final downward move. |
Triple Top
|
|
The triple top is a variation of the head and shoulders pattern. This pattern consists of three peaks of similar height. After the third peak is formed and the price movement breaks the neckline, a bearish signal is given. The expected drop should be of similar height as from the neckline to the tops. |
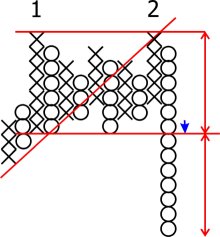
Double Top
|
|
The double top is a variation of the triple top pattern. This pattern consists of two peaks of similar height. After the second peak is formed and the price movement breaks the neckline, a bearish signal is given. The expected drop should be of similar height as from the neckline to the tops. It is important to note that before the price drop, the trend line is broken. |
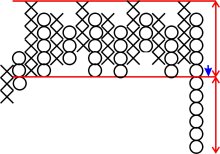
Bearish Rectangle Reversal
|
|
The uptrend forms a clear period of consolidation, the support line is then broken on a heavy volume day, it is at this point where the bearish signal occurs. |
Point and Figure Patterns
Trend Reversal Patterns
Head and Shoulders
|
|
The head and shoulders pattern
is found in candlestick, point and figure, and chart patterns and is
considered one of the most reliable reversal patterns. The price forms a high on
column one, followed by a period of consolidation. A second high is created
followed by another period of consolidation, the right shoulder is then
formed followed by a sell off. High volume should be seen on the last
downward move. Parralel support and resistance lines can
be drawn as well as a visible neckline. The height of the highest
high should give a projection of the drop of the final downward move. |
Inverted Head and Shoulders Pattern
|
|
The inverted head and
shoulders pattern is found in candlestick, point and figure, and chart
patterns and is considered one of the most reliable reversal patterns. The price forms a low on
column one, followed by a period of consolidation. A second low is created
followed by another period of consolidation, the right shoulder is then
formed followed by a buy signal as it crosses the neckline. Parralel support and resistance lines can
be drawn as well as a visible neckline. The height of the lowest
low should give a projection of the strength of the upward move. |
Triple Top
|
|
The triple top is a variation of the head and shoulders pattern. This pattern consists of three peaks of similar height. After the third peak is formed and the price movement breaks the neckline, a bearish signal is given. The expected drop should be of similar height as from the neckline to the tops. |
Triple Bottom
|
|
The triple bottom is a variation of the inverted head and shoulders pattern. This pattern consists of three lows of similar height. After the third low is formed and the price movement breaks the neckline, a bullish signal is given. The expected rise should be of similar height as from the neckline to the low. |
Double Top
|
|
The double top is a variation of the triple top pattern. This pattern consists of two peaks of similar height. After the second peak is formed and the price movement breaks the neckline, a bearish signal is given. The expected drop should be of similar height as from the neckline to the tops. It is important to note that before the price drop, the trend line is broken. |
Double Bottom
|
|
The double bottom is a variation of the triple bottom pattern. This pattern consists of two lows of similar height. After the second low is formed and the price movement breaks the neckline, a bullish signal is given. The expected rise should be of similar height as from the neckline to the tops. It is important to note that before the breakout, the trend line is broken. |
Bearish Rectangle Reversal
|
|
The uptrend forms a clear period of consolidation, the support line is then broken on a heavy volume day, it is at this point where the bearish signal occurs. |
Bullish Rectangle Reversal
|
|
The downtrend forms a clear period of consolidation, the resistance line is then broken on a heavy volume day, it is at this point where the bullish signal occurs. |
Point and Figure Patterns
"Wait and See"
Patterns
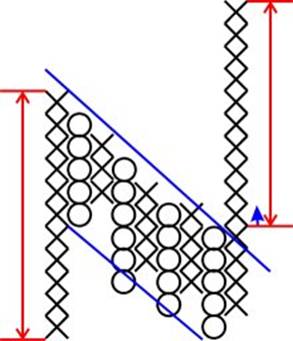
Flag
|
|
This pattern shows a large gain, followed by a period of consolidation. It then breaks past the resistance line. The height of the new breakout should be similar to that of the opening move in the pattern. |
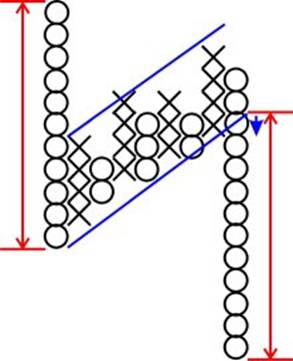
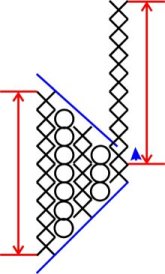
Inverted Flag
|
|
This pattern shows a large drop, followed by a period of consolidation. It then breaks past the support line. The height of the new fall should be similar to that of the opening drop in the pattern. |
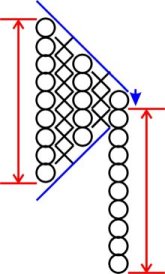
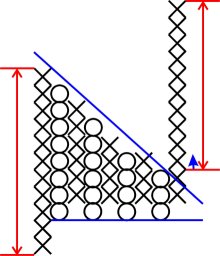
Pennant Pattern
|
|
This is a variation of the Flag pattern except for the structure of the consolidation. In this case it is triangular. The breakout should also have large volume and the height of the new breakout should be similar to that of the opening move in the pattern. |
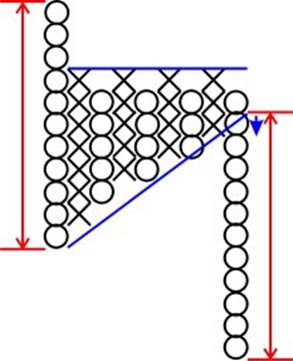
Inverted Pennant Pattern
|
|
This is a variation of the Inverted Flag pattern except for the structure of the consolidation. In this case it is triangular. The downward breakout should also have large volume and the height of the downward breakout should be similar to that of the opening move in the pattern. |
Bullish Breakout of a
Symmetrical Triangle
|
|
This pattern is similar the pennant pattern except it does not have a "pole". This pattern is rather unreliable and there is real bias to the direction it may actually take. False breakout's in this case may also occur so look for large volume to accompany the breakout. |
Bearish Breakout of a
Symmetrical Triangle
|
|
This pattern is similar the inverted pennant pattern except it does not have a "pole". This pattern is rather unreliable and there is real bias to the direction it may actually take. False breakout's in this case may also occur so look for large volume to accompany the move.. |